Know your market
before you invest
Search any city, zip, or neighborhood and get instant access to STR performance data, competitive intelligence, and revenue projections.
Know a market before you enter it
Search any city, zip, or neighborhood and instantly see active rentals, revenue ranges, occupancy, and ADR — everything you need to qualify a market in minutes.
Stop guessing, start benchmarking
See every operator, every comp, and every historical trend in one view. No more stitching together data from five different tabs before you can form a thesis.
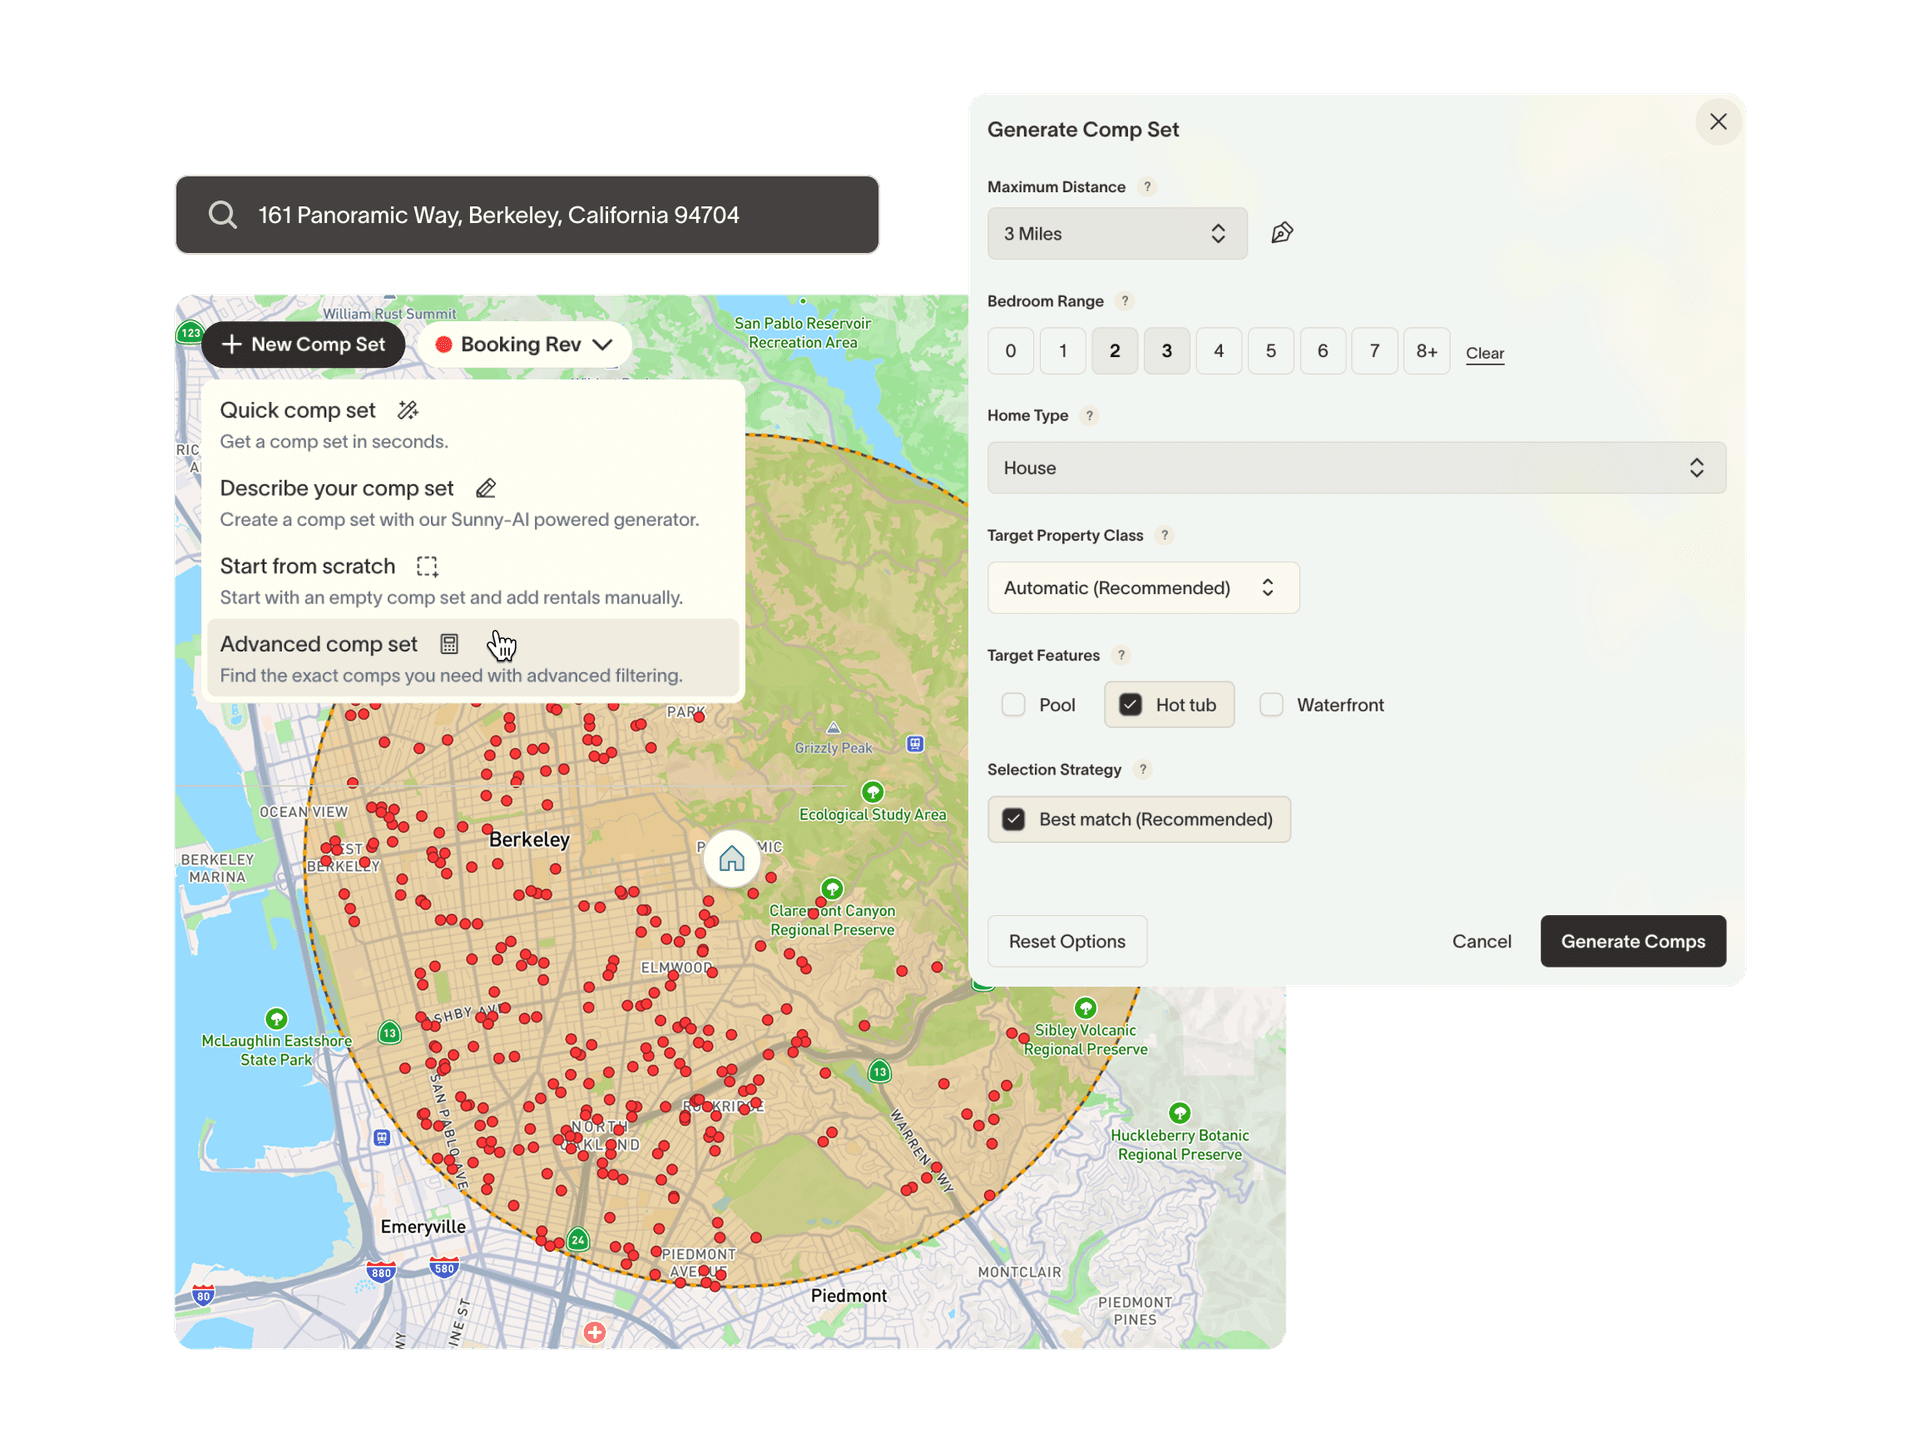
Underwrite deals with real data
Set a target property and SummerOS pulls revenue projections, auto-matches comparable listings, and tells you where your deal sits in the competitive range.
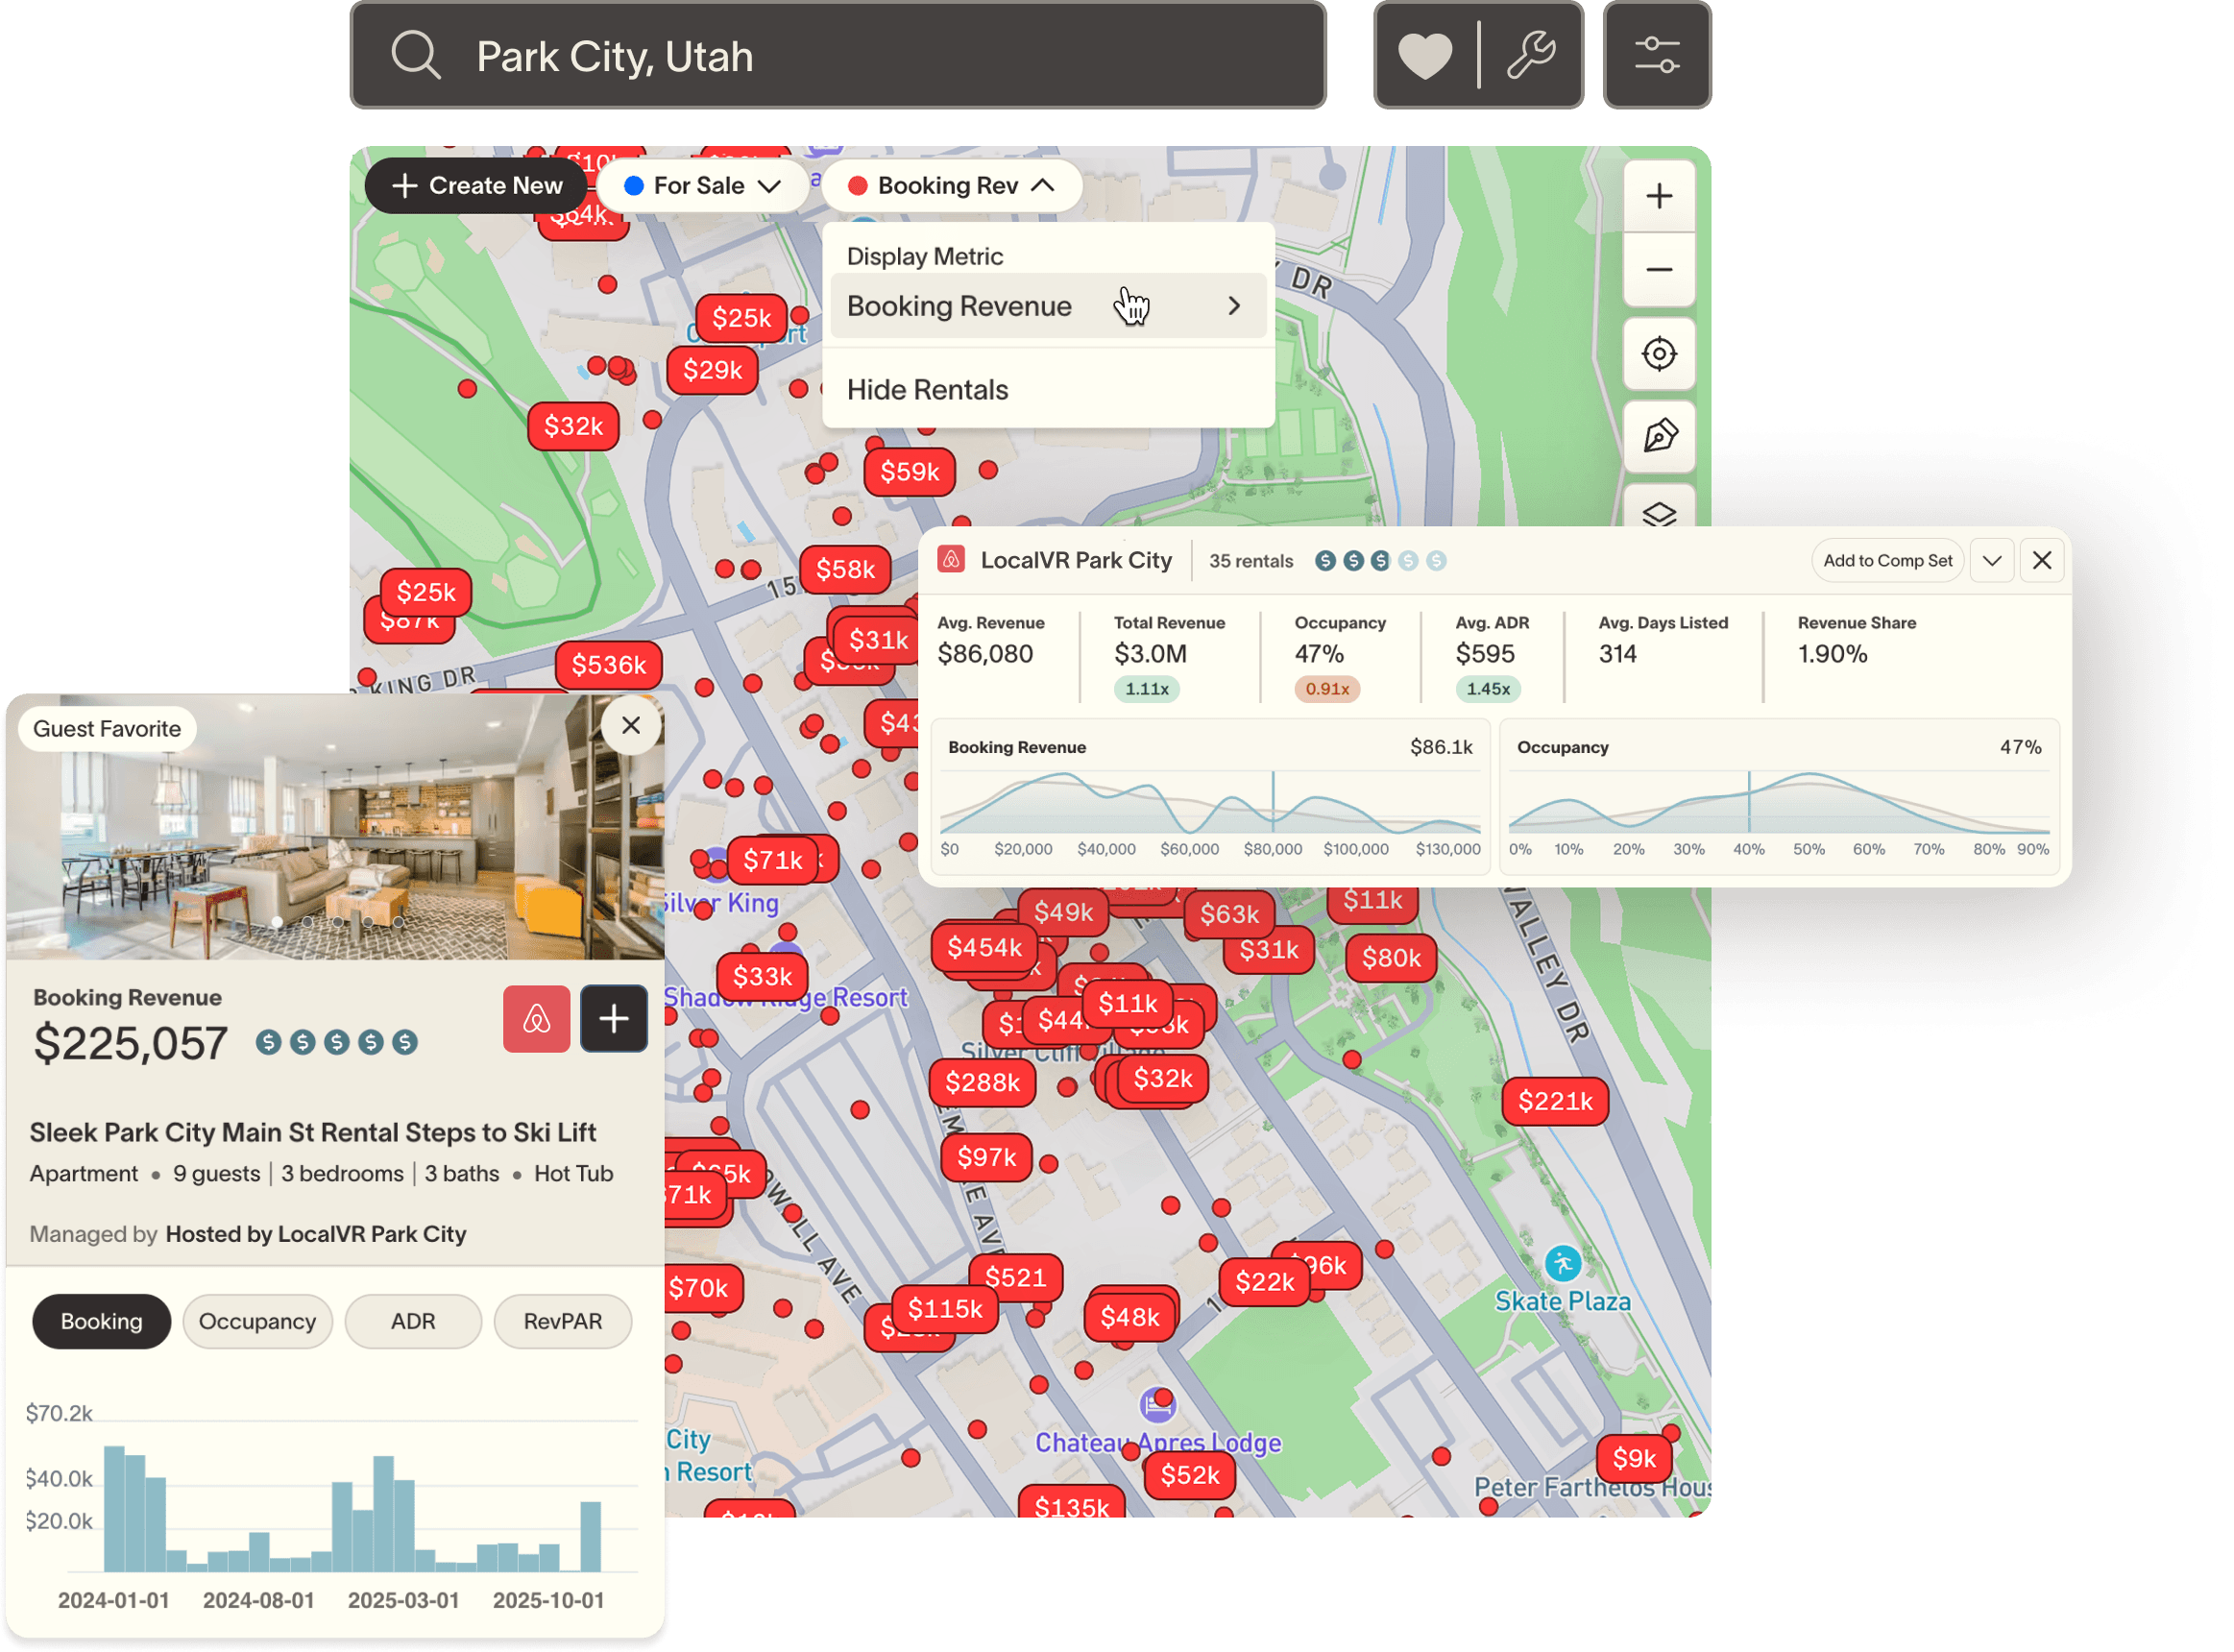
Search & Explore
Search any market in seconds.
Search & Explore
Search any market in seconds.
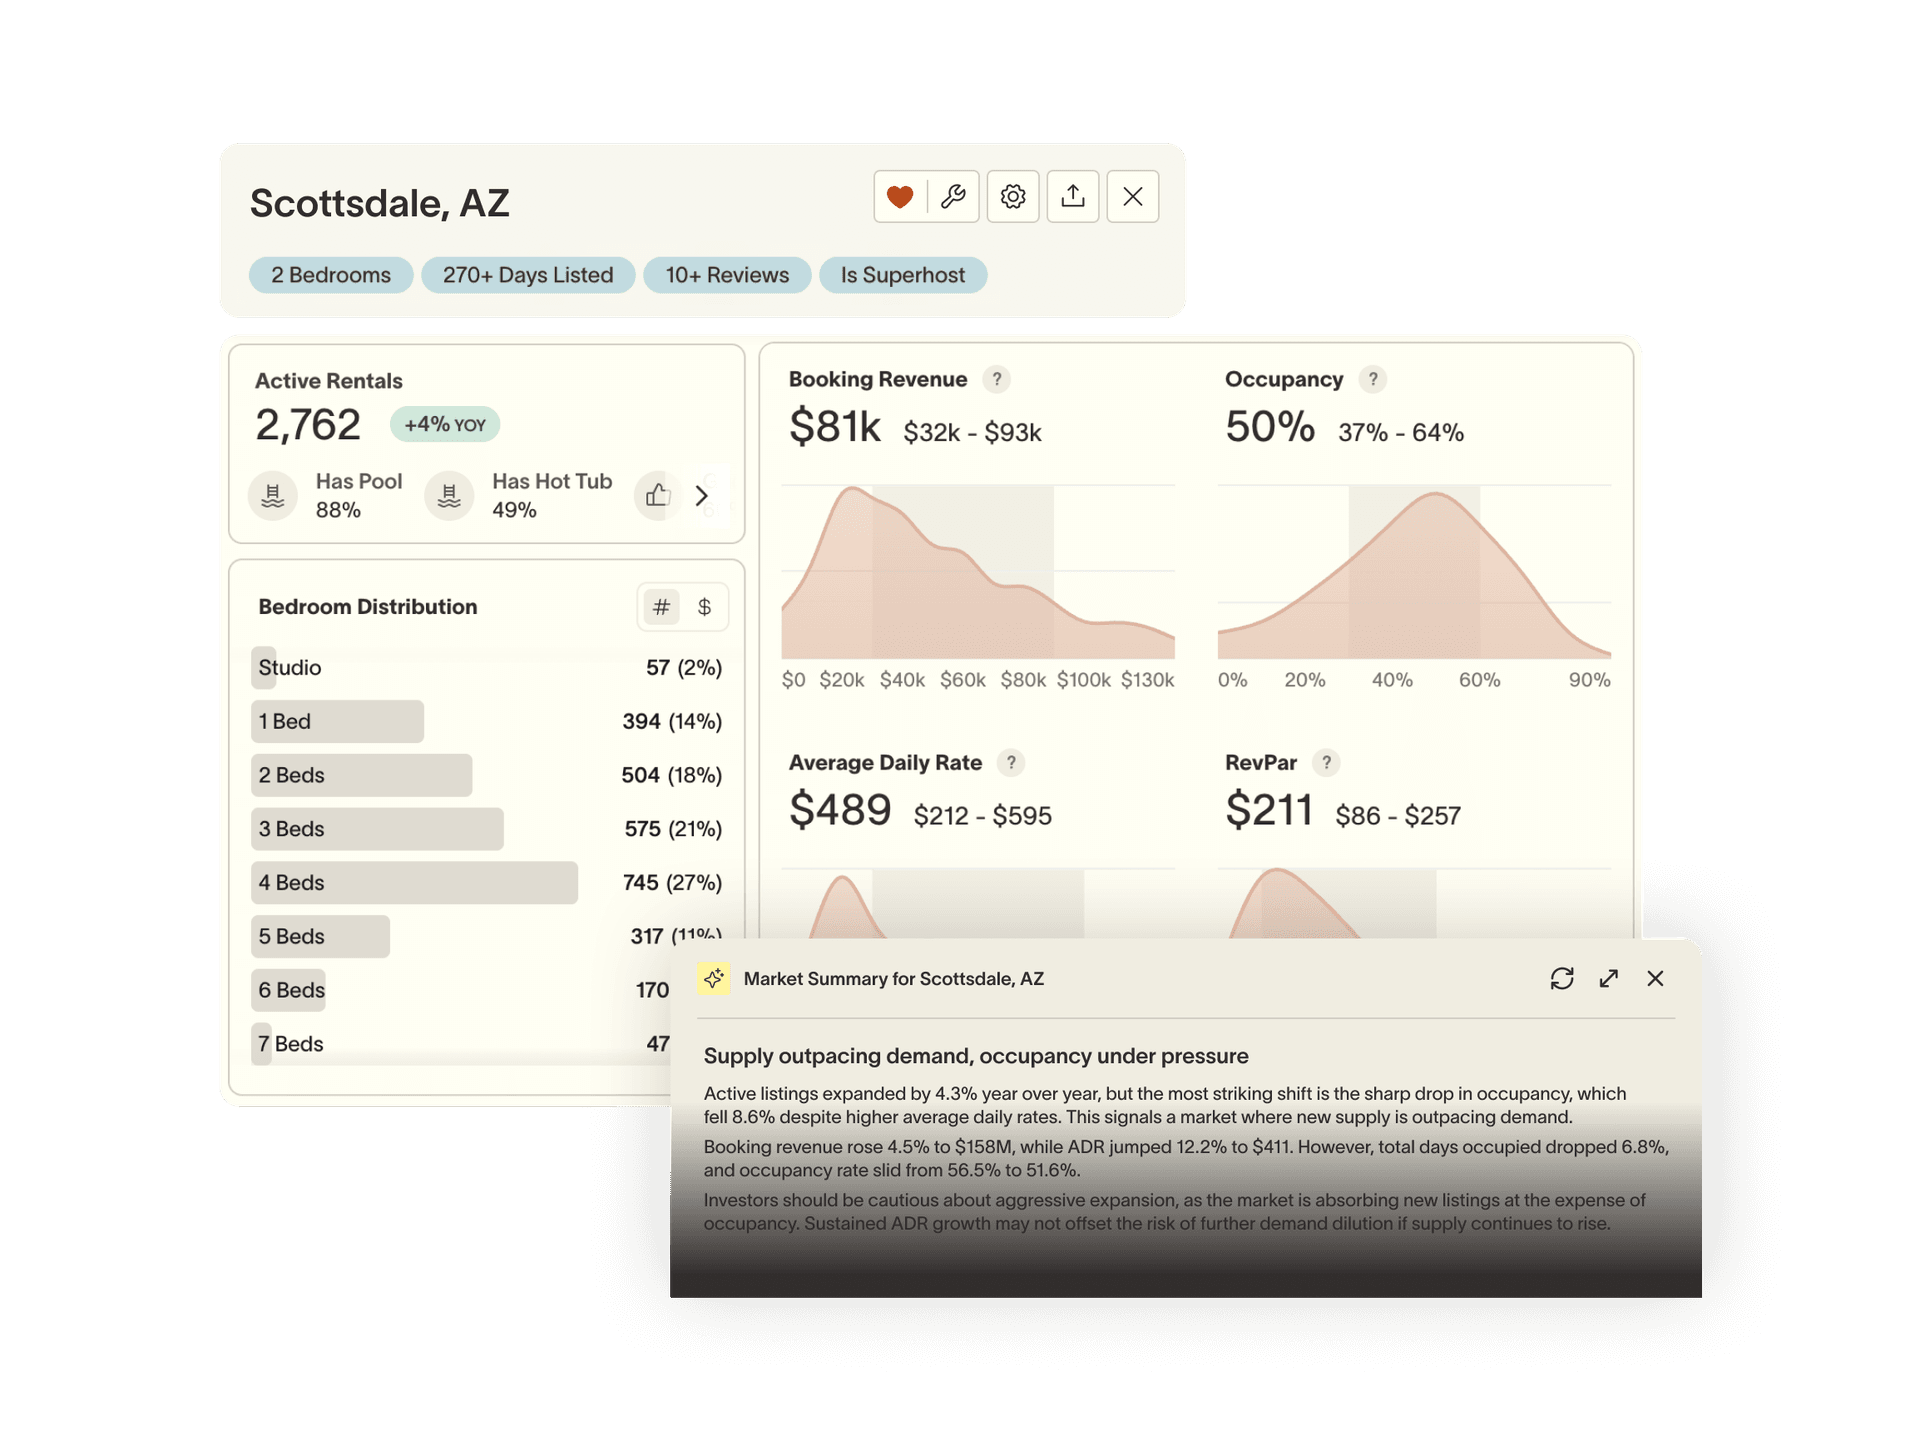
Analytics & Trends
Understand performance at every level.
Analytics & Trends
Understand performance at every level.
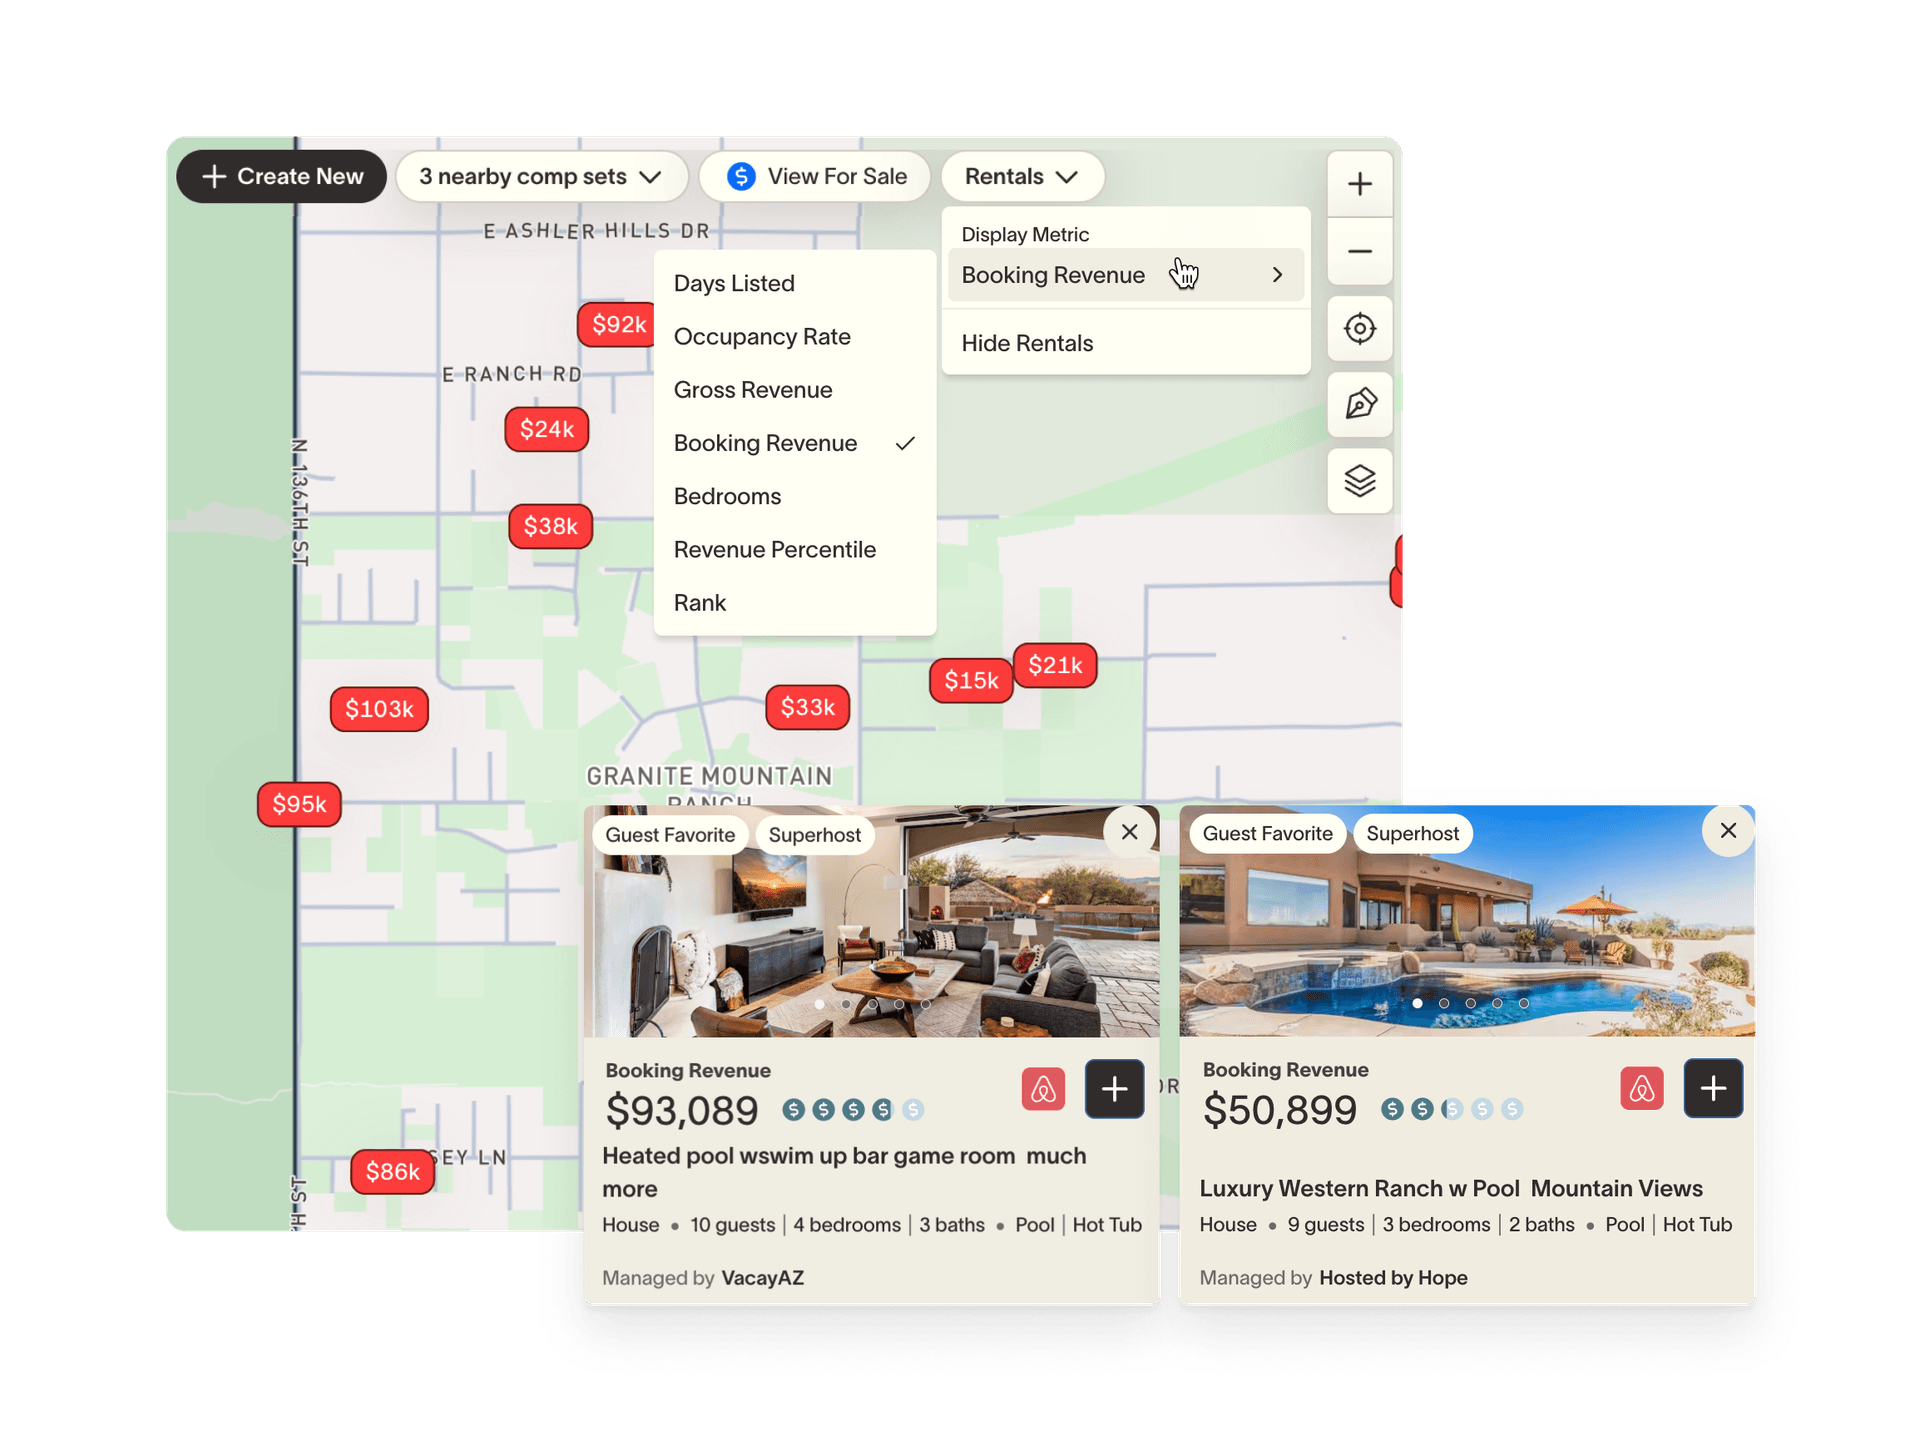
Competitive Intelligence
See exactly who you're competing with.
Competitive Intelligence
See exactly who you're competing with.
Property Analysis
Analyze a specific property against the market.
Property Analysis
Analyze a specific property against the market.
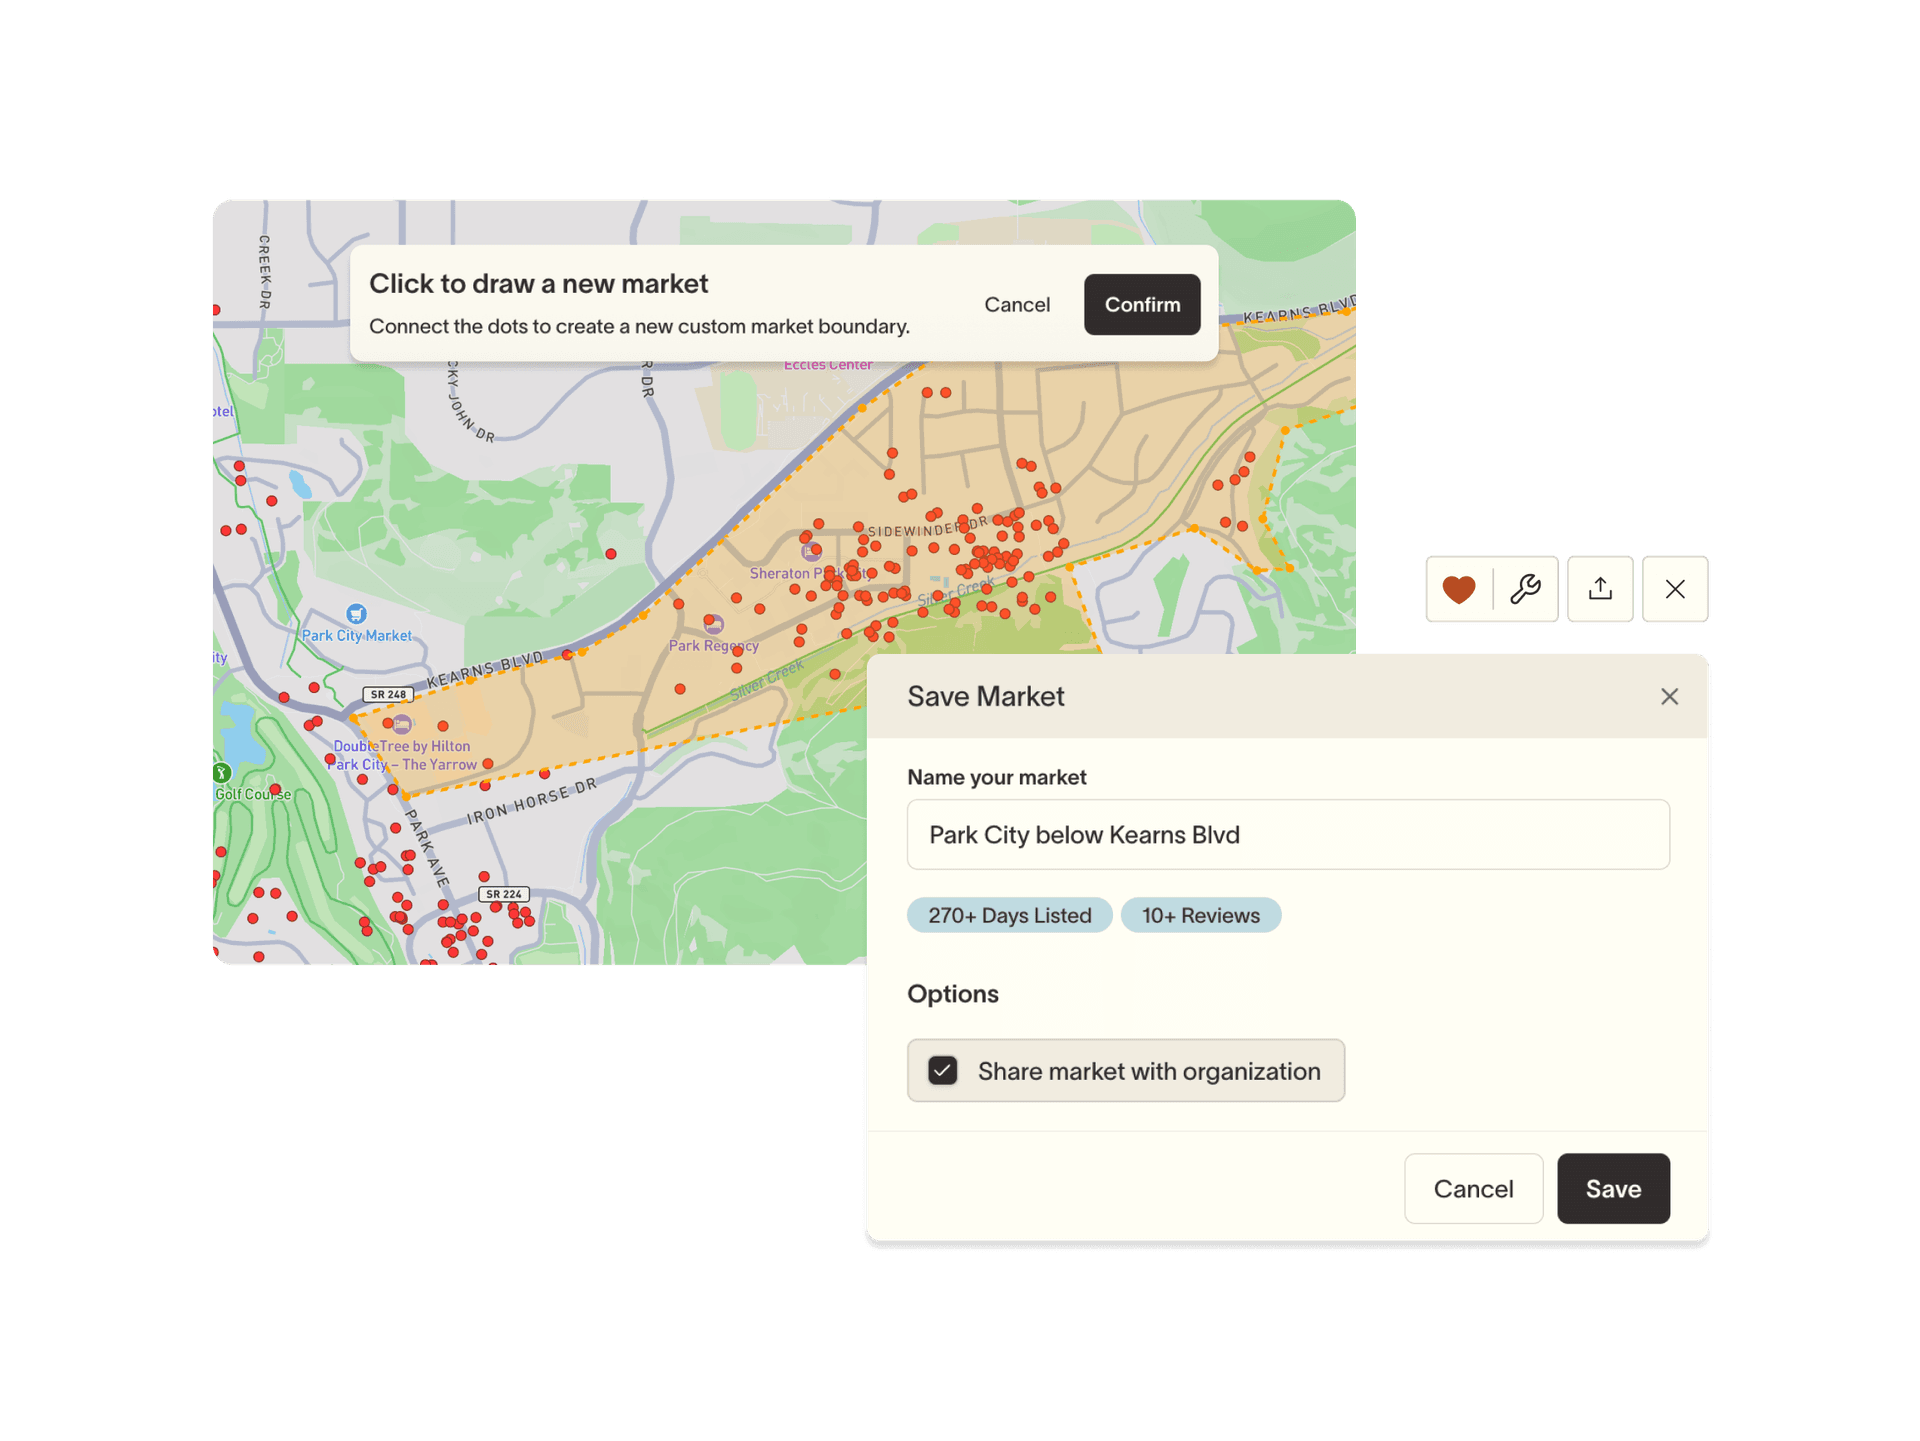
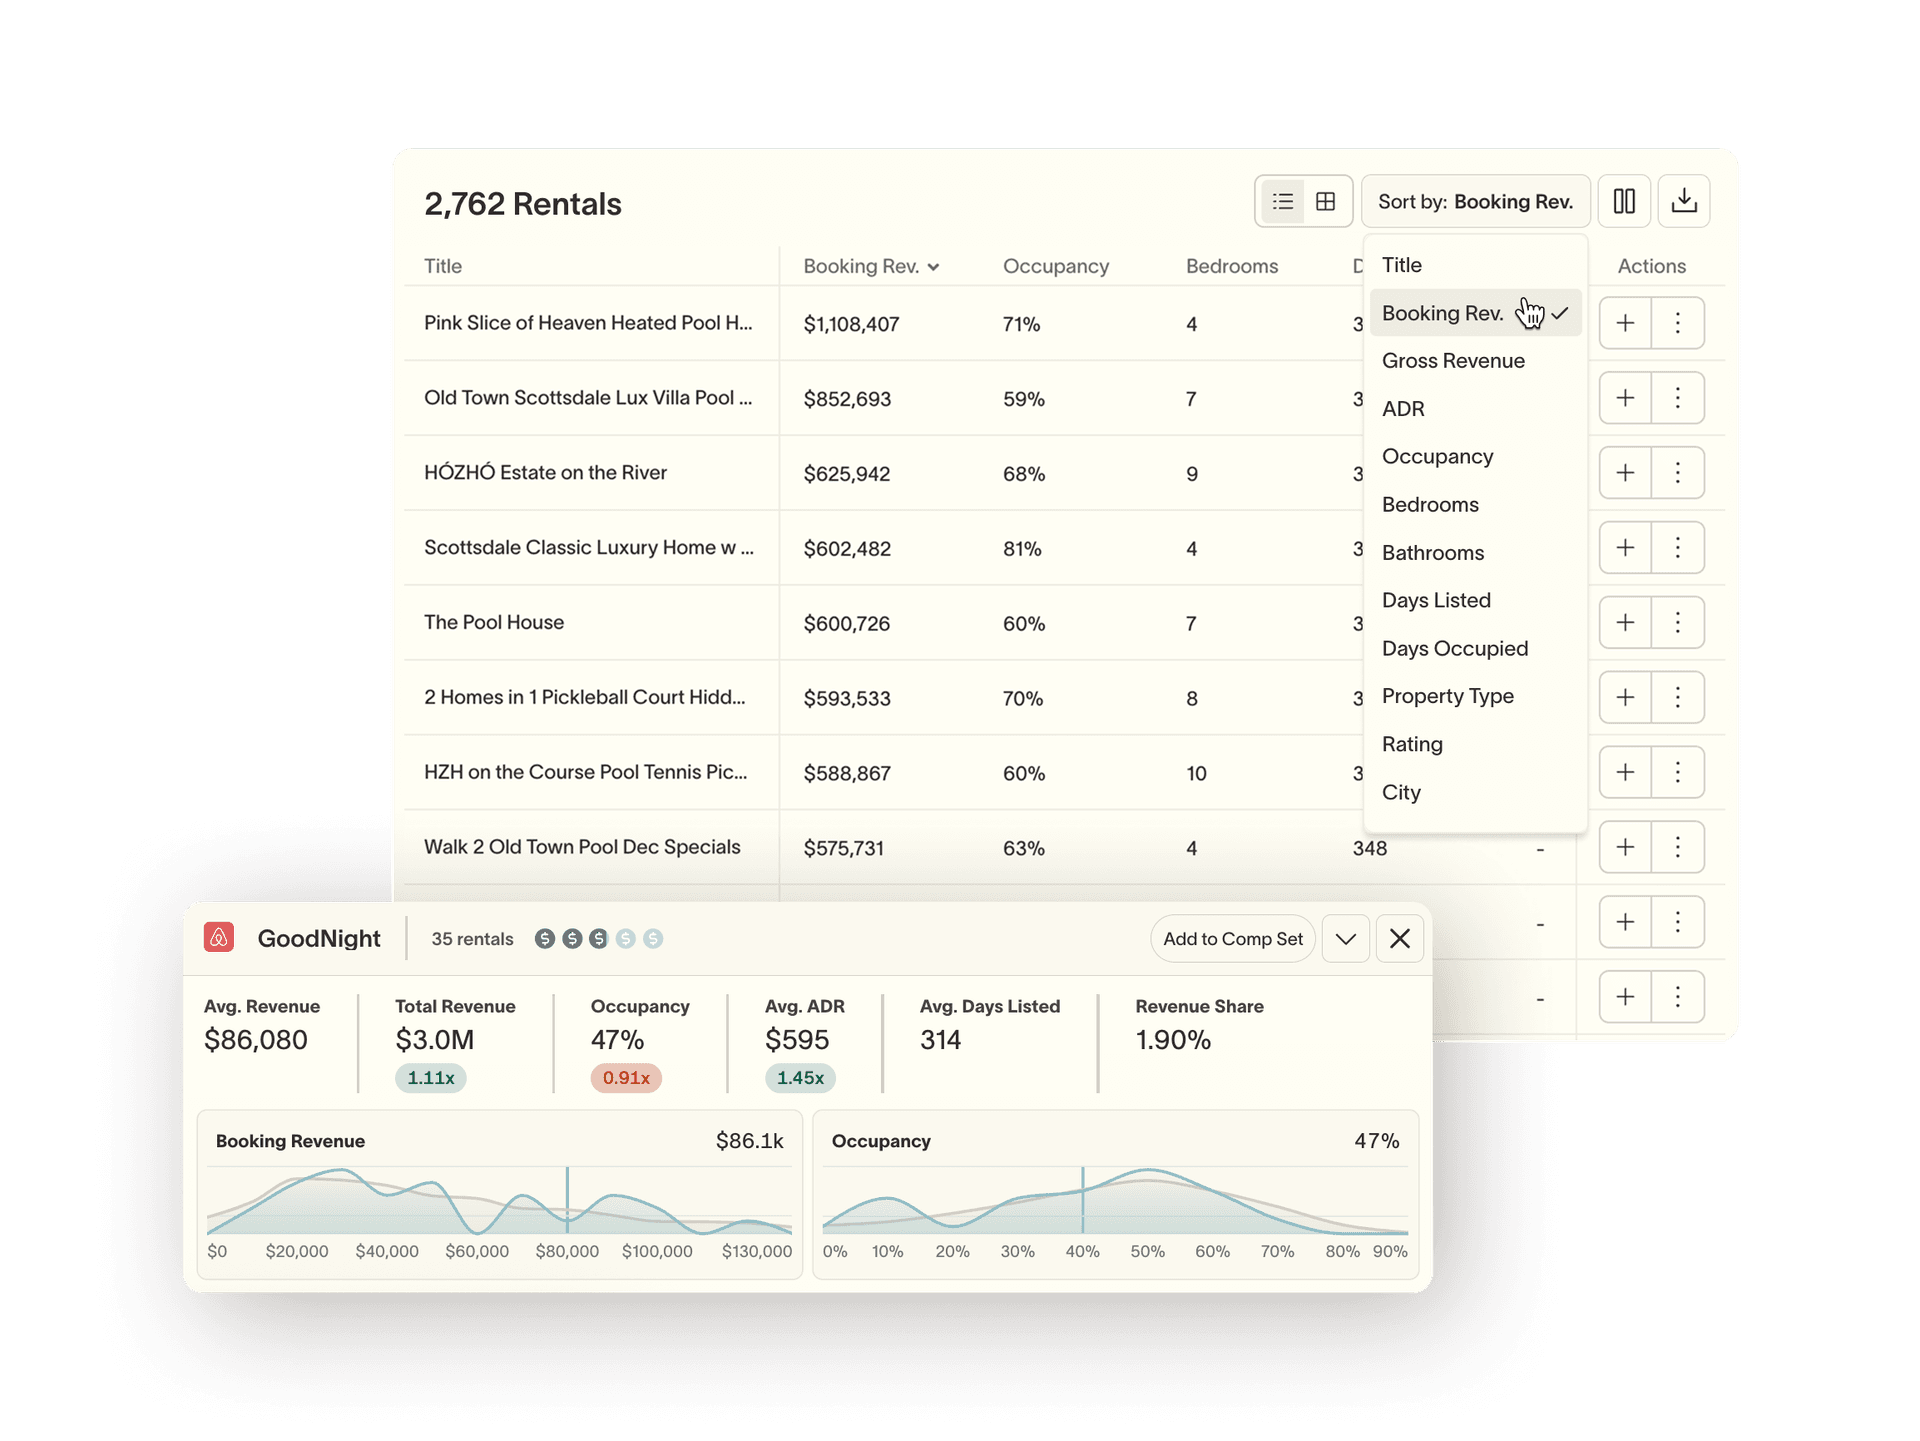
Workflow
Save, customize, and come back.
Workflow
Save, customize, and come back.

“Summer has been instrumental in helping us keep our promises to our clients, but also update them and show them how we’re performing not just based on the projections but against the overall market. It’s been a game changer.”
Landon Smith, Founder and CEO
FAQ
Stop guessing.
Start knowing.
Join the operators using professional-grade intelligence to outperform their markets.